Exploring the Green APIs
Have you ever wondered, is there an API you can call and get the carbon emission data of a specific location? It would be cool to have something like this, so we can make our applications carbon-aware, wouldn't it? Look no further! In this article I'm exploring just that!
Hi there!
This week, we're exploring Green APIs. APIs that show you carbon intensity data you can use in your code. And based on that data create some logic. For example:
- If users' location has high carbon intensity, don't load carbon intensive content on a webpage. Carbon intensive content - videos or images, for example.
- If carbon intensity in a region is high, you can automatically shift your workloads into a green one.
- Schedule batch jobs of your application when the carbon intensity is lower.
In this article, we'll go through two of them. First, I'll write a short overview about each. Then, I'll create a small Go application we can use to call these APIs. And last we'll see the methodologies used within both of them.
That's the plan. Will I be able to stick to it? Let's dive and see.
Electricity Maps
First in line is the Electricity Maps. They provide electricity data for more than 160 regions. Founded in 2016 with a goal to get us to a decarbonized electricity system. You can find more about them on their website linked below.

They are the people behind the electricity map I have mentioned in the previous posts. And they are doing a great job!
Let's see what do they offer. Checking their website, they have free and paid plans. Based on the option you choose, different features are available. They offer free-tier API calls (up to 100,000), and paid options. I am going to look into the free-tier.
On the type of data they are offering, you have two options:
- Use APIs to make applications carbon-aware
- Granular carbon accounting
With the first option, they provide data based on which you can create logic in your app. You call the API, you get a JSON response. The second option focuses on carbon accounting and creating reports on the scope 2 emissions. Data includes consumption-based emissions factors from both direct operations and life cycle analysis (LCA) for the years 2021-2022.
Here, we'll use the first option, and the Free subscription for that option. I want to play around and test the APIs available in the free tier. Maybe I'll use it in future to make my website carbon-aware. Who knows...
Testing out the APIs
After selecting the Free option, I easily log in by providing e-mail, name, last name, password... You know the drill. When I filled this information in, I am redirected to their API Portal. The screenshot of the portal is below.
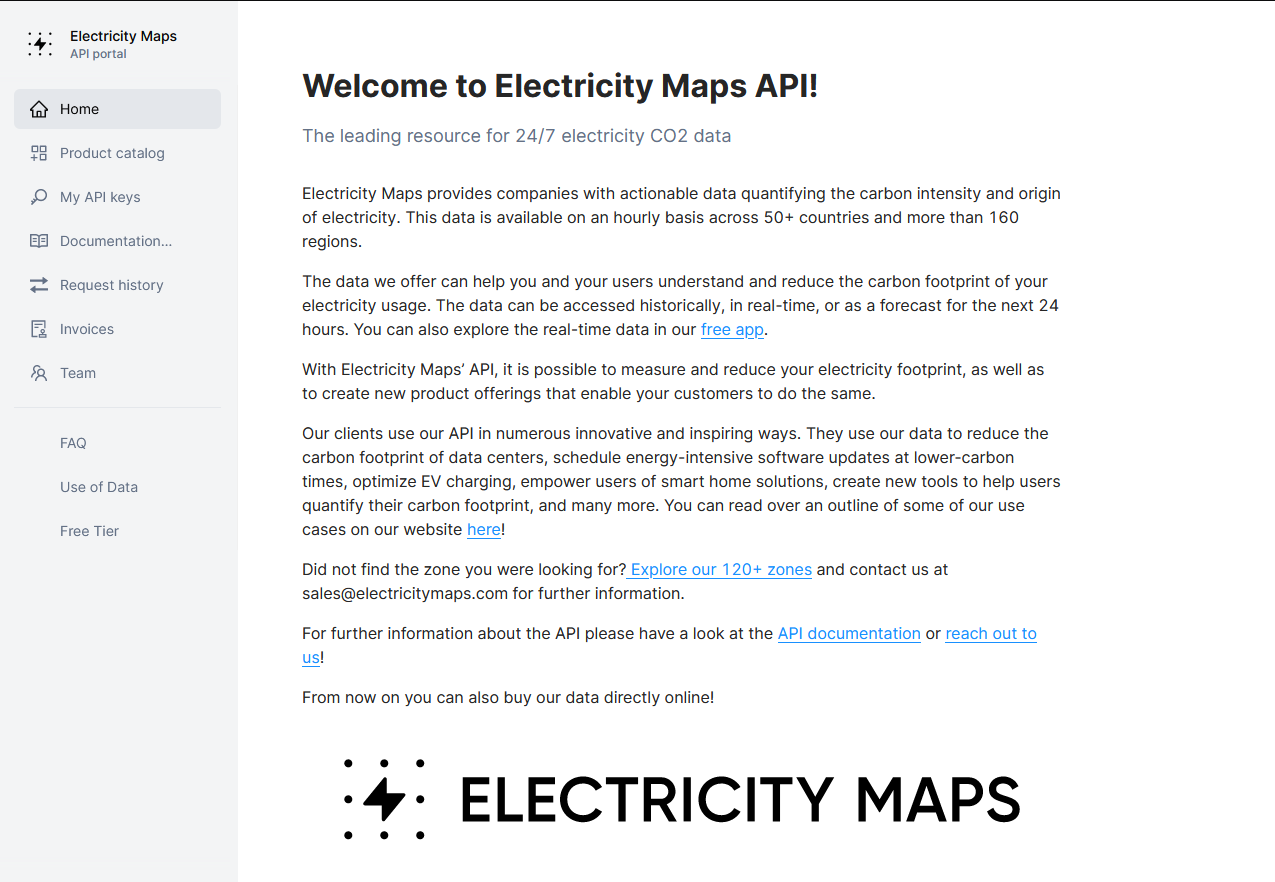
And this portal has everything you need! It has extensive documentation, list of available APIs with example code snippets. You can use those snippets in your app rather easy. Which as it turns out, will be quite useful for this article!
Below is the example application written in Go. It shows you latest carbon intensity per specified zone. I've specified RS zone for the country where I live in. I've also omitted the auth-token which is a way to authenticate with the API.
package main

import (
  "fmt"
  "io/ioutil"
  "net/http"
  "encoding/json"
  "bytes"
)

func main() {

  url := "https://api-access.electricitymaps.com/free-tier/carbon-intensity/latest?zone=RS"

  req, _ := http.NewRequest("GET", url, nil)

  // here you need to change YOUR_AUTH_TOKEN with the token from your registered profile
  req.Header.Add("auth-token", "YOUR_AUTH_TOKEN")

  res, _ := http.DefaultClient.Do(req)
  defer res.Body.Close()

  body, _ := ioutil.ReadAll(res.Body)

  fmt.Println(jsonPrettyPrint(string(body)))

}

// jsonPrettyPrint() takes the JSON string and formats it to a readable format
func jsonPrettyPrint(in string) string {
  var out bytes.Buffer
  err := json.Indent(&out, []byte(in), "", "\t")
  if err != nil {
      return in
  }
  return out.String()
}
The output data is shown below.
{
	"zone": "RS",
	"carbonIntensity": 510,
	"datetime": "2023-11-10T07:00:00.000Z",
	"updatedAt": "2023-11-10T06:45:48.660Z",
	"createdAt": "2023-11-07T07:47:23.027Z",
	"emissionFactorType": "lifecycle",
	"isEstimated": true,
	"estimationMethod": "TIME_SLICER_AVERAGE"
}
Here you can see the time when I've queried the API, and the carbon intensity. The value is in grams of CO2 equivalence per kWh, or gCO2eq/kWh. You also have the emission factor type, and the estimation method. Both of which we'll explain in the next section.
I was able to create this example in a couple of minutes after logging. Without using any AI prompts. Just by following examples and instructions clearly written and stated on the portal. That is how it should be!
Methodology
Now, what about the data provided by the Electricity Maps, where is it from? How do they calculate the carbon intensity?
The data comes from a variety of public data sources. Those sources can be transmission system operators, balancing entities, or market operators. The complete list of data sources shows where the data is sourced from.
If I go a step further and check out the data source for Serbia, it shows the ENTSOE. I don't know what this means, so I'll dig deeper.
The ENTSOE stands for European Network of Transmission System Operators for Electricity. It represents 39 electricity TSOs (Transmission System Operators) from 35 countries across Europe. It is established to promote closer cooperation of the TSOs across Europe. To support the implementation of EU energy policy, and achieve Europe's energy and climate policy objectives.
This organization publishes an Implementation Guide for the transparent data extraction process.
Thanks, Wikipedia!
The data the Electricity Maps gets is then processed and formatted with different parsers in a uniform way. The formatted data is then saved in the db and processed using the flow-tracing algorithm.
The flow-tracing algorithm follows the flow (whether it’s power, data, or something else) through a system to understand how it operates or to identify specific characteristics. It’s like a roadmap that shows you how to get from point A to point B, and all the stops you make along the way.
The ENTSOE.py parser, used for Serbia and other ENTSOE members, can be found on the link below. All parsers are open-source, and the contribution is more than welcome! Pretty neat, isn't it!
 electricitymaps
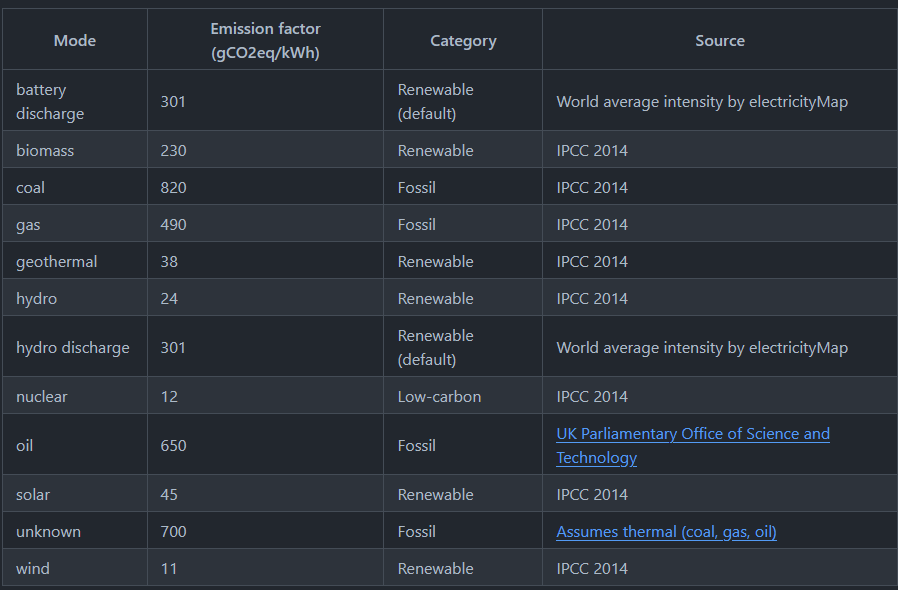
Calculation of carbon intensity is done by multiplying the power production from each source by the corresponding emission factors. The emission factors depend on different parameters. These parameters can be production source, the region and many others. Data is calculated with a number of regional and global emission factors. The table below shows the default Life-cycle emission factors.
Some part of the methodology used is published on the Electricity Maps GitHub Wiki, and their Blog. Feel free to check them out for more information and reference.
WattTime API
The second API that I'm going to explore is the WattTime. It is a nonprofit that offers technology solutions that help in achieving emissions reductions. The nonprofit was founded in 2014, first tried on hackathon in 2013! Similar to the Electricity Maps, WattTime provides the electricity data for many regions across the world. To find out more, check out their website linked below.
The WattTime has, as well, an excellent documentation of the API.
By default, they offer a free plan, which is nice. But, it's a rather limited one. You can access and query only one region/zone. All others are forbidden. Like Electricity Maps, they offer paid plans, but, the price is not published. You need to e-mail them for paid plans.
Anyhow, the registration and the login process is done via API. They offer comprehensive Python scripts/snippets on how to register, and perform login. I'm going to use Golang in my use-case. And I'll register for the free plan.
Testing out the API
First, let's register by running the below code.
package main

import (
    "bytes"
    "encoding/json"
    "fmt"
    "log"
    "net/http"
)

func main() {

    // add your USERNAME and PASSWORD
    values := map[string]string{
      "username": "USERNAME",
      "password": "PASSWORD",
      "email": "wondering.chimp@tuta.io",
      "org": "Wondering Chimp",
    }

    json_data, err := json.Marshal(values)

    if err != nil {
        log.Fatal(err)
    }

    url := "https://api2.watttime.org/v2/register"
    resp, err := http.Post(url, "application/json",
        bytes.NewBuffer(json_data))

    if err != nil {
        log.Fatal(err)
    }

    defer resp.Body.Close()

    var res map[string]interface{}

    json.NewDecoder(resp.Body).Decode(&res)

    fmt.Println(res)
}
After that, you should get the somewhat similar response to the below one.
{
  "user": "USERNAME",
  "ok": "User created"
}
Next, let's get a token and get the grid emission data for the only one available region (CAISO_NORTH).
package main

import (
  "fmt"
  "io/ioutil"
  "net/http"
  "net/url"
  "strings"
  "bytes"
  "encoding/json"
)

func main() {
  loginURL := "https://api2.watttime.org/v2/login"
  req, _ := http.NewRequest("GET", loginURL, nil)
  // you will need to change this line with your USERNAME and PASSWORD
  req.SetBasicAuth("USERNAME", "PASSWORD")

  resp, _ := http.DefaultClient.Do(req)
  defer resp.Body.Close()
  body, _ := ioutil.ReadAll(resp.Body)
  token := strings.Split(string(body), ":")[1]
  token = strings.TrimRight(strings.TrimLeft(token, "\""), "\"}\n")

  dataURL := "https://api2.watttime.org/v2/data"
  req, _ = http.NewRequest("GET", dataURL, nil)
  req.Header.Add("Authorization", "Bearer "+token)

  params := url.Values{}
  params.Add("ba", "CAISO_NORTH")
  params.Add("starttime", "2023-11-05T20:30:00-0800")
  params.Add("endtime", "2023-11-05T22:30:00-0800")
  req.URL.RawQuery = params.Encode()

  resp, _ = http.DefaultClient.Do(req)
  defer resp.Body.Close()
  body, _ = ioutil.ReadAll(resp.Body)

  fmt.Println(jsonPrettyPrint(string(body)))
}

func jsonPrettyPrint(in string) string {
  var out bytes.Buffer
  err := json.Indent(&out, []byte(in), "", "\t")
  if err != nil {
      return in
  }
  return out.String()
}
You should get the response similar to the below one.
[
...
        {
                "point_time": "2023-11-06T04:50:00.000Z",
                "value": 950.0,
                "frequency": 300,
                "market": "RTM",
                "ba": "CAISO_NORTH",
                "datatype": "MOER",
                "version": "3.2"
        },
        {
                "point_time": "2023-11-06T04:45:00.000Z",
                "value": 950.0,
                "frequency": 300,
                "market": "RTM",
                "ba": "CAISO_NORTH",
                "datatype": "MOER",
                "version": "3.2"
        },
        {
                "point_time": "2023-11-06T04:40:00.000Z",
                "value": 954.0,
                "frequency": 300,
                "market": "RTM",
                "ba": "CAISO_NORTH",
                "datatype": "MOER",
                "version": "3.2"
        },
        {
                "point_time": "2023-11-06T04:35:00.000Z",
                "value": 955.0,
                "frequency": 300,
                "market": "RTM",
                "ba": "CAISO_NORTH",
                "datatype": "MOER",
                "version": "3.2"
        },
        {
                "point_time": "2023-11-06T04:30:00.000Z",
                "value": 963.0,
                "frequency": 300,
                "market": "RTM",
                "ba": "CAISO_NORTH",
                "datatype": "MOER",
                "version": "3.2"
        }
]
Same as the above, we get the JSON data with which we can play around further.
Methodology
WattTime uses grid's marginal emissions rate. And the API provides access to real-time, forecast, and historical marginal emission data. The rate provided is the Marginal Operating Emissions Rate (MOER). The unit is pounds of emissions per megawatt-hour (e.g. CO2 lbs/MWh). So to use it in the metric system part of the world, we would need to convert that to gCO2eq/kWh.
WattTime has built a marginal emissions model based on the empirical technique founder Gavin McCormick published. The fundamental approach of all those models is a somewhat similar.
- Data is reported by emissions monitoring system through EPA CAMPD program from the power plants within the US. Through the US Environmental Protection Agency Clean Air Markets Program Data. And now I finally understand why do they abbreviate everything there! I assume this is something similar to ENTSOE.
- Each system then applies a regression-based modeling to ask every time a rise or fall in electricity demand occurs, which power plants increase/decrease their output in response.
This allows for comparing marginal emissions by time and place.
To discover more about their methodology, check out the link below.
Key Takeaways
The purpose of this article is not a comparison of the two. My goal was to explore the options and write down the things I found. Following are some key points I would like you to take from this article.
- The APIs that give us carbon emissions data are there and waiting to be used!
- Both of these I've written about offer free and paid options, which is good. If you are not paying for services, that often times means that you are the product.
- The first step would be to use any of them.
- To achieve the best results, we can test and use both, and compare them. Maybe one works better for us.
Thanks for staying with the article until the end! If you liked it, feel free to share it with your friends, colleagues, peers, and on your social media. Also, feel free to use the comment section below to add your comments, overview, experience.
See you in the next article!