Demoing the Cloud Carbon Footprint tool
Estimating carbon emissions from cloud resources can be hard. Especially because providers can be quite "stingy" with the reporting. In this article, we look into Cloud Carbon Footprint tool. What it is, what it does, and how it can help you get (better) overview of emissions from cloud resources.
Hello everyone!
In this article, I'm going to write about the Cloud Carbon Footprint tool. In short, it's an application that estimates energy usage and carbon emissions of various cloud providers.
We will explore the following:
- What this tool is?
- How it works?
- How the application looks like?
- How it differs from tools provided by other cloud platforms?
- How to run it locally?
What is the Cloud Carbon Footprint tool?
This application helps you see all your energy usage estimates and carbon emissions in one place. If you have resources running in multiple cloud providers, this tool can be of help. It shows all the estimates in one place. There is no need to jump from one cloud provider service to another. All in one place.
How it works?
In a nutshell, it pulls usage data from cloud providers and calculates the estimated energy and GHG emissions. Estimated energy is expressed in Watt-Hours, and GHG emissions in metric tons CO2e. If you need a reminder on what CO2e is, check out my earlier article.
The estimations are calculated in the following way. (Copy from the documentation alert!)
Total CO2e = operational emissions + embodied Emissions
Where:
Operational emissions = (Cloud provider service usage) x (Cloud energy conversion factors [kWh]) x (Cloud provider Power Usage Effectiveness (PUE)) x (grid emissions factors [metric tons CO2e])
And:
Embodied Emissions = estimated metric tons CO2e emissions from the manufacturing of datacenter servers, for compute usage
The documentation of the application is great! Check out the longer version of the methodology on the link below.

How the application looks like?
The Application Web UI is pretty neat! The image below shows the overview of it.
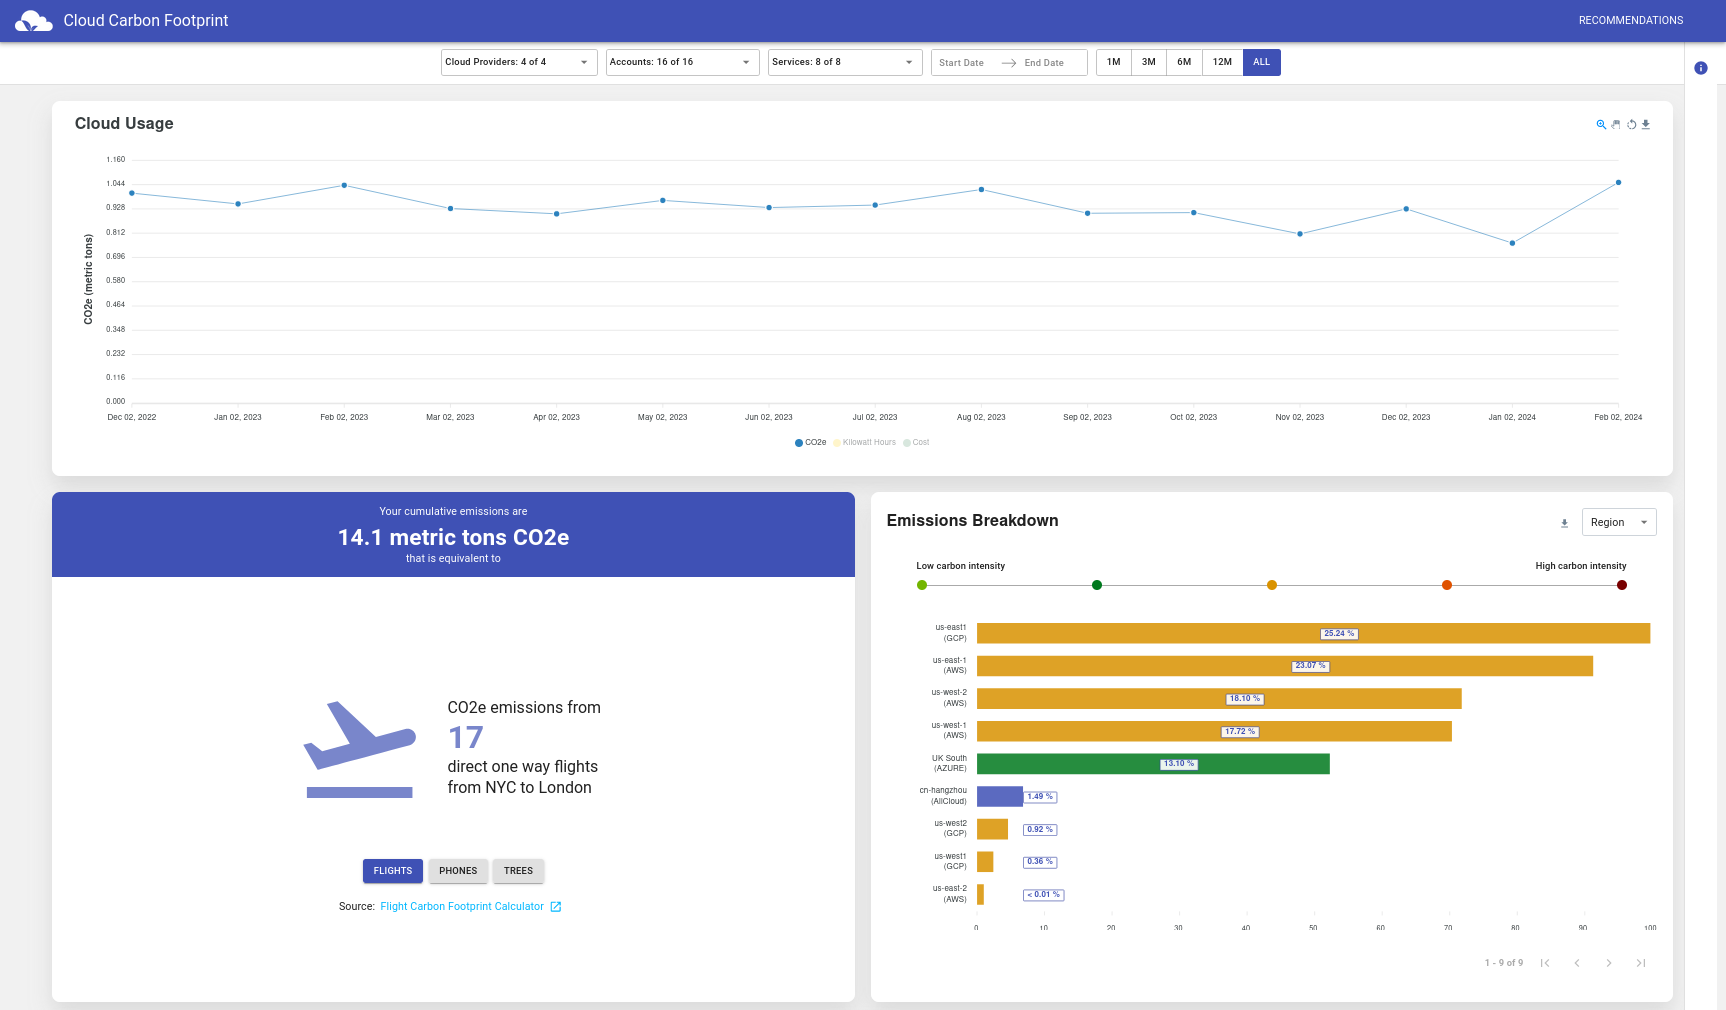
To check it out yourself, and play around, visit the application demo on the link below.
How it differs from tools provided by other cloud platforms?
The application currently supports AWS, Google Cloud and Microsoft Azure. It provides the estimated values. Those estimates are not meant as a replacement for data from cloud providers. More like a complement.
They also provide integration with Electricity Maps API. For real-time carbon intensity emissions factors instead of the default values. To find out more about Electricity Maps API, check out my article below.
How to run it locally?
Let's get our hands dirty now, and run the application locally. You can run it by executing yarn scripts or using docker compose. I chose the latter approach, because I'm lazy. And also, running yarn would require for me to install it, and also install node.js. I opted for an easier approach. Yeah, right.
In this demo, I'm going to configure the CCF to run with the GCP platform. I already prepared some resources running there, so let's give it a try.
I first started with cloning the application repository, as recommended in the documentation.
git clone --branch latest https://github.com/cloud-carbon-footprint/cloud-carbon-footprint.git
cd cloud-carbon-footprint
After that, I went through the guide on connecting the GCP data to the application. In a nutshell, I did the following:
- Create a GCP service account with
roles/bigquery.dataViewerandroles/bigquery.jobUserpermissions - Set up a Google Cloud billing data to export to BigQuery
- Create an
.envfile based on theenv.templatein the repository - Created
dockersecrets - Updated the
docker-compose.ymlfile - Run the
docker compose upfrom the root of the repo.
The following link provides you thorough instructions on how to complete most of the steps above. Heads up, it also links to a lot of GCP instruction documents to set up service account and BigQuery.
Here is the overview of the .env file I've been using.
# GCP

# Variables needed for the Billing Data (Holistic) approach with GCP:
GCP_USE_BILLING_DATA=true
# Optionally set this variable if you want to include or not include from estimation request - defaults to true.
GCP_INCLUDE_ESTIMATES=true
GCP_USE_CARBON_FREE_ENERGY_PERCENTAGE=true
GOOGLE_APPLICATION_CREDENTIALS=/location/of/service-account-keys.json
GCP_BIG_QUERY_TABLE=your-project-id.data-set-name.table
GCP_BILLING_PROJECT_ID=your-project-id
GCP_BILLING_PROJECT_NAME="Your Project Name"

# Variables to help configure average vcpu's to get more accurate date from GKE and Cloud Composer
GCP_VCPUS_PER_GKE_CLUSTER=10
GCP_VCPUS_PER_CLOUD_COMPOSER_ENVIRONMENT=10

# Variables needed for the Cloud Usage API (Higher Accuracy) approach with GCP:
GCP_PROJECTS=[{"id":"your-project-id","name":"Your Project Name"}]

GCP_RESOURCE_TAG_NAMES=[] # ["tag:ise-api-enabler-access, label:goog-composer-location, project:twproject"]


# Additional Configurations

# To enable the use of the Electricity Maps API for carbon intensity data, set the following variable to your token:
ELECTRICITY_MAPS_TOKEN=api-token
As you can see, I've also tried to enable the integration with Electricity Maps API by adding the token.
Heads up! You will need to update the .env file per your settings. Make sure that you copy the whole value for GCP_BIG_QUERY_TABLE from GCP BigQuery table. I had some issues with not providing the correct name, so running of the application failed.
After that, I wanted to generate docker secrets. In the documentation, they recommend running the yarn create-docker-secrets. Since I don't have yarn installed, I've checked the package.json file and saw that the script is calling the create-docker-secrets.sh script. I found it in the packages/api/ directory, and run it.
Heads up! You will also need to put your .env file in this (packages/api) directory!
./create-docker-secrets.sh
This script generated all necessary secrets in the $HOME/.docker/secrets directory. Here is the output of the directory.
$ ls -lha ~/.docker/secrets/
total 56K
drwxrwxr-x 2 user group 4.0K Feb 16 09:23 .
drwxrwxr-x 3 user group 4.0K Feb 16 08:36 ..
-rw-rw-r-- 1 user group   14 Feb 16 08:48 ELECTRICITY_MAPS_TOKEN
-rw-rw-r-- 1 user group   89 Feb 16 09:23 GCP_BIG_QUERY_TABLE
-rw-rw-r-- 1 user group   20 Feb 16 08:48 GCP_BILLING_PROJECT_ID
-rw-rw-r-- 1 user group   19 Feb 16 08:48 GCP_BILLING_PROJECT_NAME
-rw-rw-r-- 1 user group    5 Feb 16 08:48 GCP_INCLUDE_ESTIMATES
-rw-rw-r-- 1 user group   57 Feb 16 08:48 GCP_PROJECTS
-rw-rw-r-- 1 user group   85 Feb 16 08:48 GCP_RESOURCE_TAG_NAMES
-rw-rw-r-- 1 user group    5 Feb 16 08:48 GCP_USE_BILLING_DATA
-rw-rw-r-- 1 user group    5 Feb 16 08:48 GCP_USE_CARBON_FREE_ENERGY_PERCENTAGE
-rw-rw-r-- 1 user group    3 Feb 16 08:48 GCP_VCPUS_PER_CLOUD_COMPOSER_ENVIRONMENT
-rw-rw-r-- 1 user group    3 Feb 16 08:48 GCP_VCPUS_PER_GKE_CLUSTER
-rw-rw-r-- 1 user group   54 Feb 16 08:48 GOOGLE_APPLICATION_CREDENTIALS
The final edit was to the docker-compose.yml file. I needed to remove all the values that I was not using, so the docker compose setup completes. Here is the overview of the file I've used.
version: '3.9'

services:
  client:
    image: cloudcarbonfootprint/client:latest
    ports:
      - '80:80'
    volumes:
      - ./docker/nginx.conf:/etc/nginx/nginx.conf
    depends_on:
      - api
  api:
    image: cloudcarbonfootprint/api:latest
    ports:
      - '4000:4000'
    volumes:
      - $HOME/.config/gcloud/service-account-keys.json:/root/.config/gcloud/service-account-keys.json
    secrets:
      - GCP_BIG_QUERY_TABLE
      - GCP_BILLING_PROJECT_ID
      - GCP_BILLING_PROJECT_NAME
      - ELECTRICITY_MAPS_TOKEN
    environment:
      # set the CACHE_MODE to MONGODB to use MongoDB
      - CACHE_MODE=LOCAL
      - GCP_USE_BILLING_DATA=true
      - GCP_USE_CARBON_FREE_ENERGY_PERCENTAGE=true
      - GOOGLE_APPLICATION_CREDENTIALS=/root/.config/gcloud/service-account-keys.json
      - GCP_BIG_QUERY_TABLE=/run/secrets/GOOGLE_APPLICATION_CREDENTIALS
      - GCP_BILLING_PROJECT_ID=/run/secrets/GCP_BIG_QUERY_TABLE
      - GCP_BILLING_PROJECT_NAME=/run/secrets/GCP_BILLING_PROJECT_ID
secrets:
  GCP_BIG_QUERY_TABLE:
    file: ~/.docker/secrets/GCP_BIG_QUERY_TABLE
  GCP_BILLING_PROJECT_ID:
    file: ~/.docker/secrets/GCP_BILLING_PROJECT_ID
  GCP_BILLING_PROJECT_NAME:
    file: ~/.docker/secrets/GCP_BILLING_PROJECT_NAME
  ELECTRICITY_MAPS_TOKEN:
    file: ~/.docker/secrets/ELECTRICITY_MAPS_TOKEN
After I had everything of the above set and complete, I run the following command.
docker compose up
This created two containers, one for the application, and the other for the API.
$ docker ps
CONTAINER ID   IMAGE                                COMMAND                  CREATED       STATUS          PORTS                                       NAMES
22aca61d4487   cloudcarbonfootprint/client:latest   "/docker-entrypoint.…"   2 hours ago   Up 29 minutes   0.0.0.0:80->80/tcp, :::80->80/tcp           cloud-carbon-footprint-client-1
04624e02bab2   cloudcarbonfootprint/api:latest      "docker-entrypoint.s…"   2 hours ago   Up 29 minutes   0.0.0.0:4000->4000/tcp, :::4000->4000/tcp   cloud-carbon-footprint-api-1
Opening the localhost on my local browser, I got the following screen.
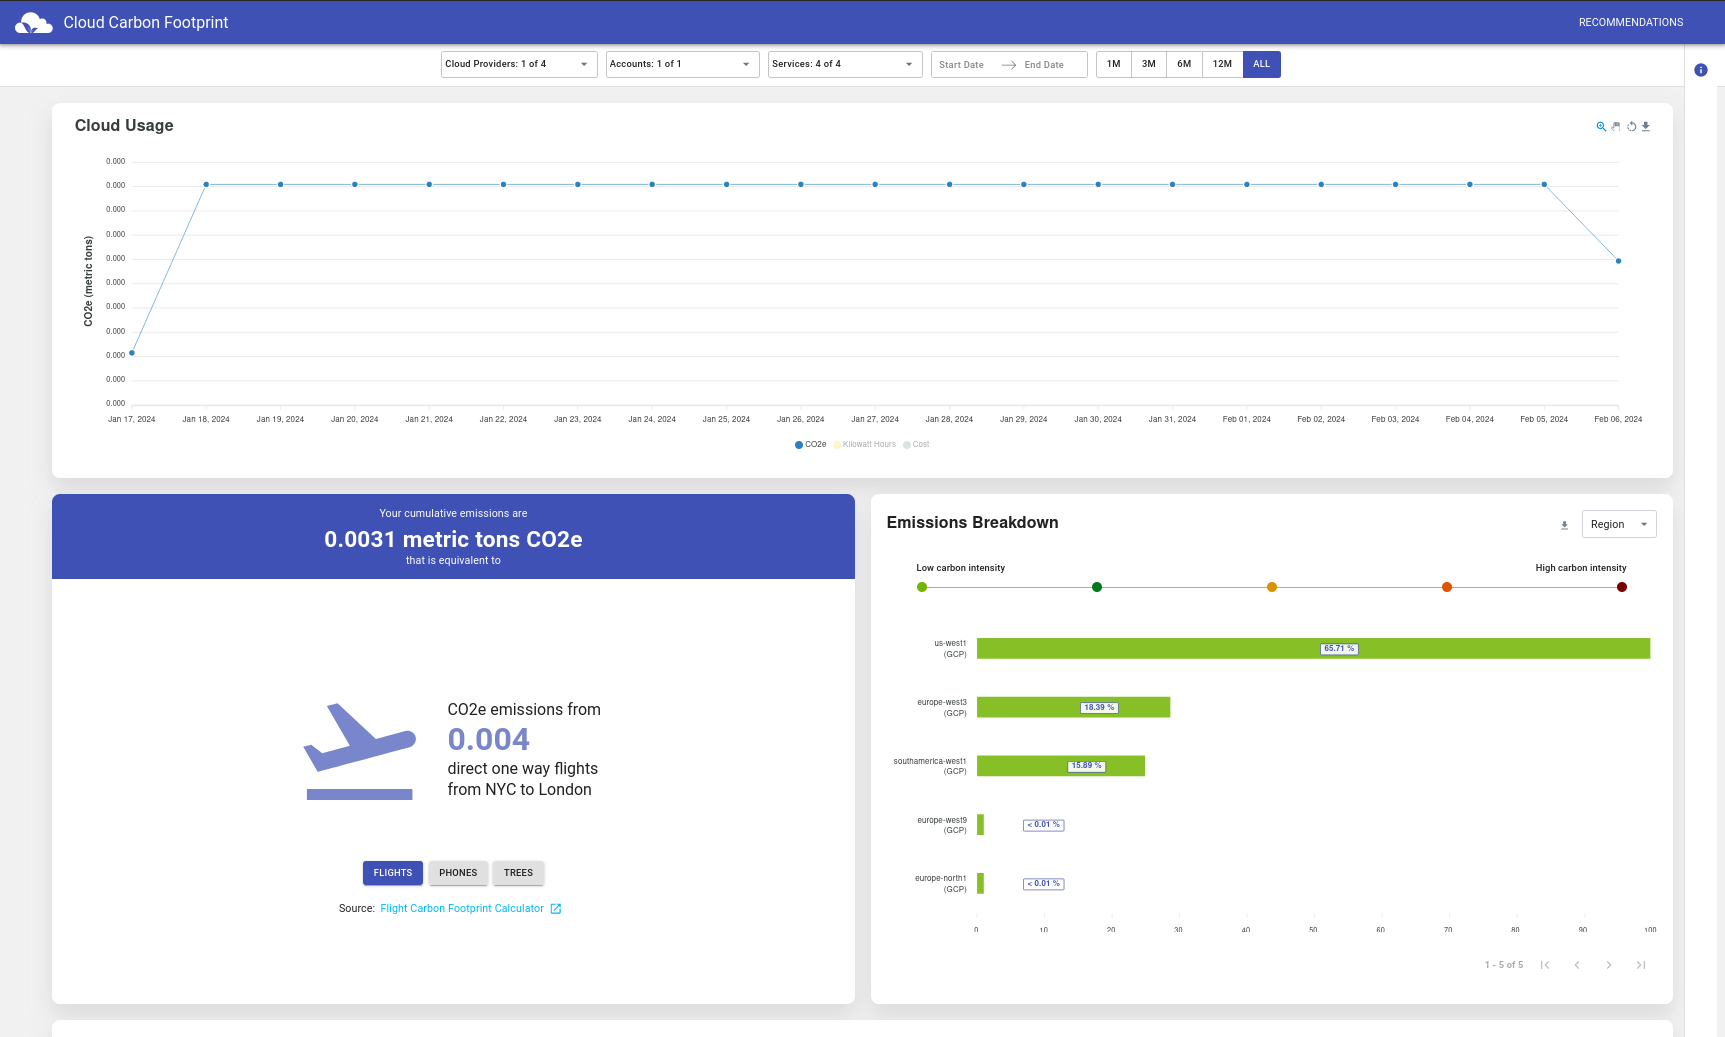
As you can see, the data is available! You (in this case I), can go through the dashboards and further check where are the emissions coming from. Pretty nice!
Notes on the side! When I configured everything, I needed to wait for some time to get the data. This might be due to BigQuery setup on GCP. Additionally, I've used a trial token for Electricity Maps API. It has only a couple of regions available. This made the application timeout a couple of times. In the end, I needed to remove the token, so the application could start. I got plenty of warnings, similar to below.
...
api-1     | 2024-02-17T08:03:47.476Z [BillingExportTable] warn: Electricity Maps zone data was not found for us-west1. Using default emissions factors.
api-1     | 2024-02-17T08:03:47.567Z [BillingExportTable] warn: Electricity Maps zone data was not found for us-west1. Using default emissions factors.
api-1     | 2024-02-17T08:03:47.802Z [BillingExportTable] warn: Electricity Maps zone data was not found for southamerica-west1. Using default emissions factors.
api-1     | 2024-02-17T08:03:47.903Z [BillingExportTable] warn: Electricity Maps zone data was not found for southamerica-west1. Using default emissions factors.
api-1     | 2024-02-17T08:03:48.059Z [BillingExportTable] warn: Electricity Maps zone data was not found for europe-west3. Using default emissions factors.
...
Let's now compare the values with the ones from the GCP Carbon Footprint tool. Check out the image below.
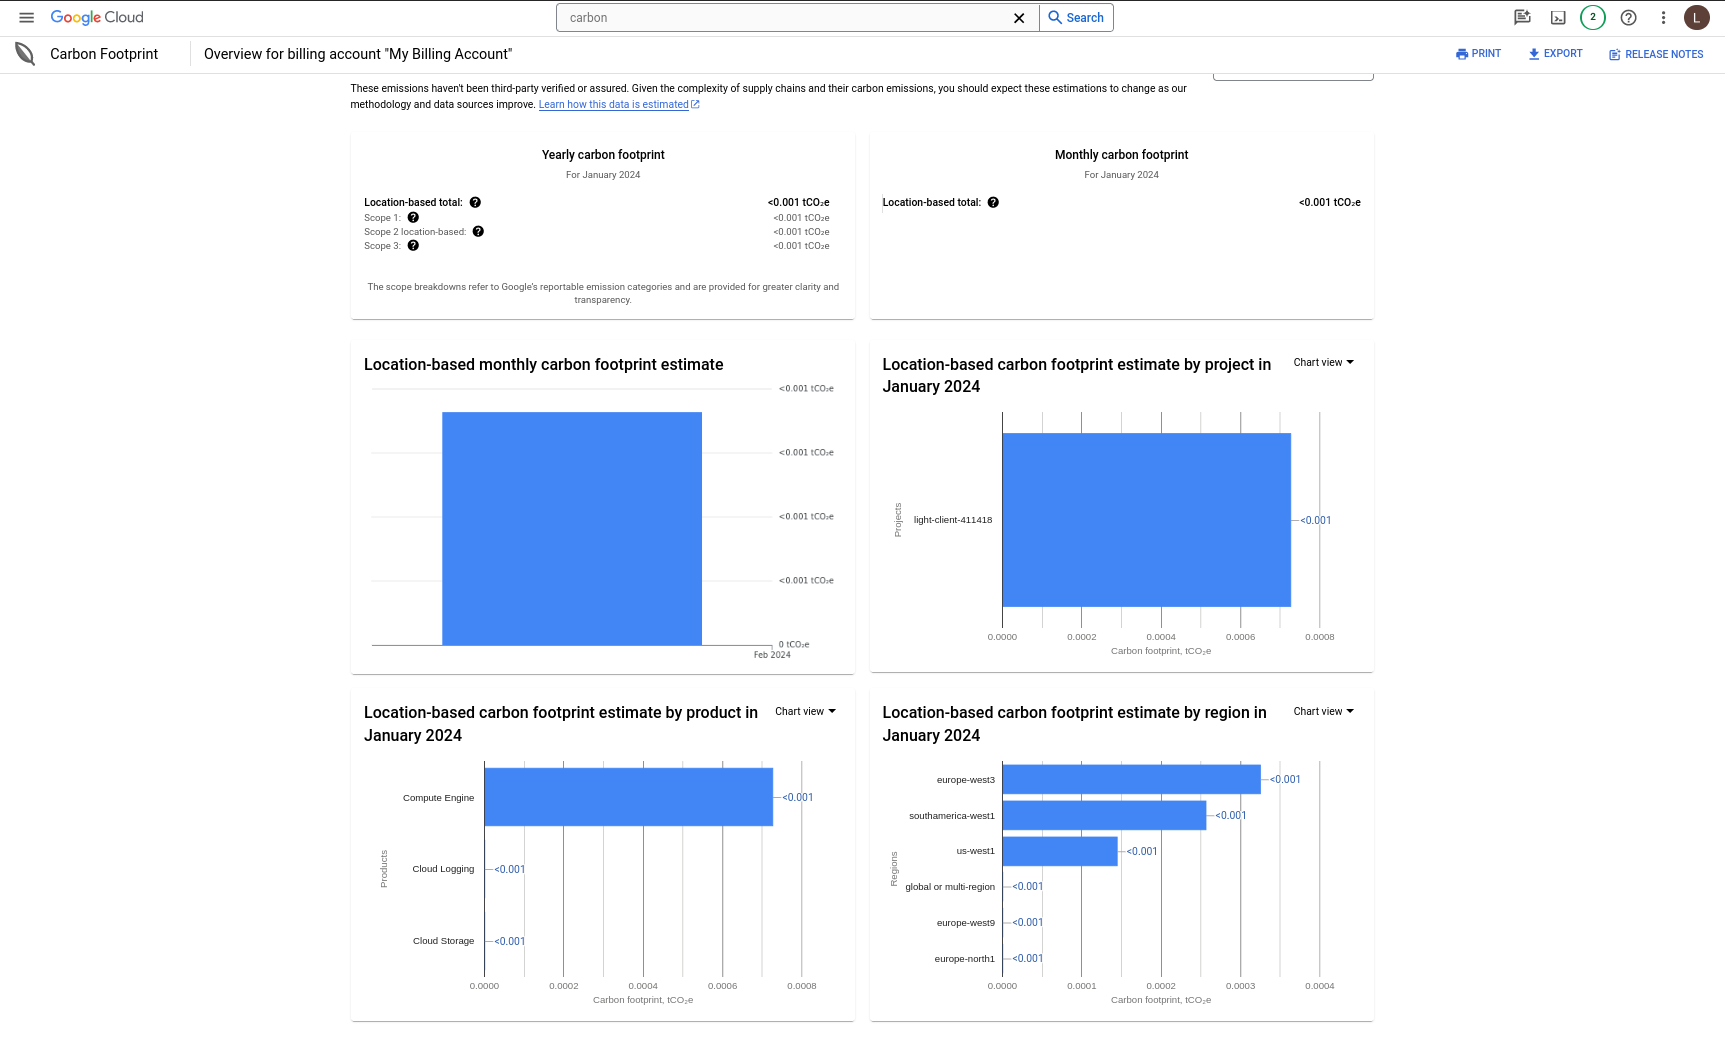
From first look, it seems that the values from the CCF are more fine-grained than those on the GCP. CCF also can connect to Electricity Maps API, which shows live emissions factors. I'm not sure if GCP shows that. Probably not.
Anyhow, the CCF is not meant to replace the tools from cloud providers, it complements them.
Summary
Even though I had some challenges with the setup, I find it quite nice and useful. I really like the Emissions Equivalencies panel (I named it). The one on the bottom left. It puts emissions from your resources into different contexts - flights, phones, and how many trees could sequester the carbon emissions from resources. It might need some improvements (talking from the deployment side). Nevertheless, I am looking forward to future releases.
The application itself is small, not requiring a lot of resources, sort of easy to set up and run... And the most important thing - it shows you necessary data in one place! It's definitely a good starting point.
Check out the GitHub repository for more information.
 cloud-carbon-footprint
Now, in an ideal world, cloud providers would expose more comprehensive data about resource energy usage and GHG emissions. Not just only scope 1 and 2, but also scope 3. Better yet, we wouldn't be in this place to start with.
However, since we're not living in an ideal world, this tool can help us improve the reporting and knowledge about our resource emissions.
Let me know the in the comments below, what do you think about the tool and the article itself!