Data centres and an increase in energy consumption
Have you ever wondered how the AI impacted the energy and water consumptions of data centres? In this article, we delve into that question.
Hi everyone!
In this week's article, we're going to talk about data centres. If you remember from before, I've already written about the energy efficiency of data centres. At the time of writing that article, the AI hype was going strong, however, the reports for energy efficiency of data centres were missing. We didn't know, or didn't want to know, how the (over)use of AI impacts the energy consumption.
Well, we sort of have the numbers now. And they aren't good. Here, I want to go through those numbers, see what do they mean for the overall data centre energy usage, and show you some of the examples from the wild that could be good things to implement, work on, and have available.
Let's start from the top.
In their environmental/sustainability reports, both Microsoft and Google showed the increase in energy and water usage. Charts below show the increase in both energy and water usage. I got the numbers from their official reports here and here.
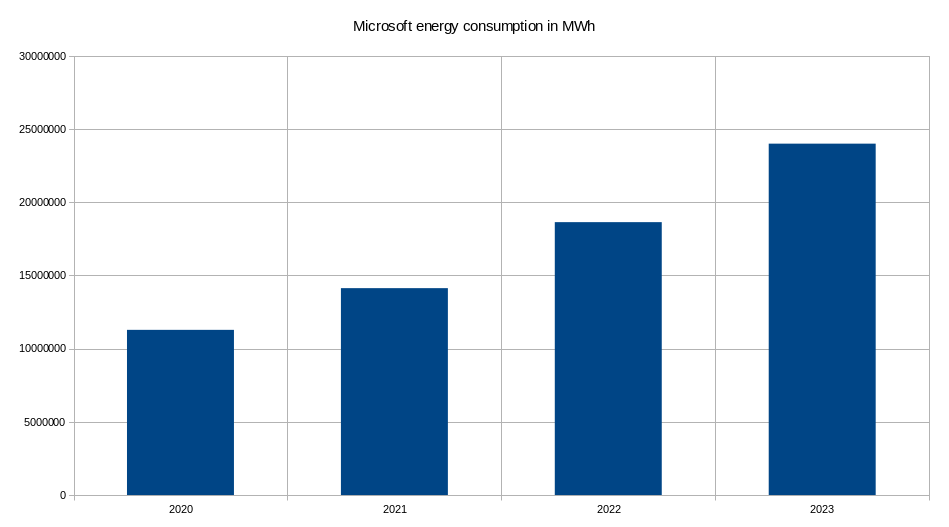
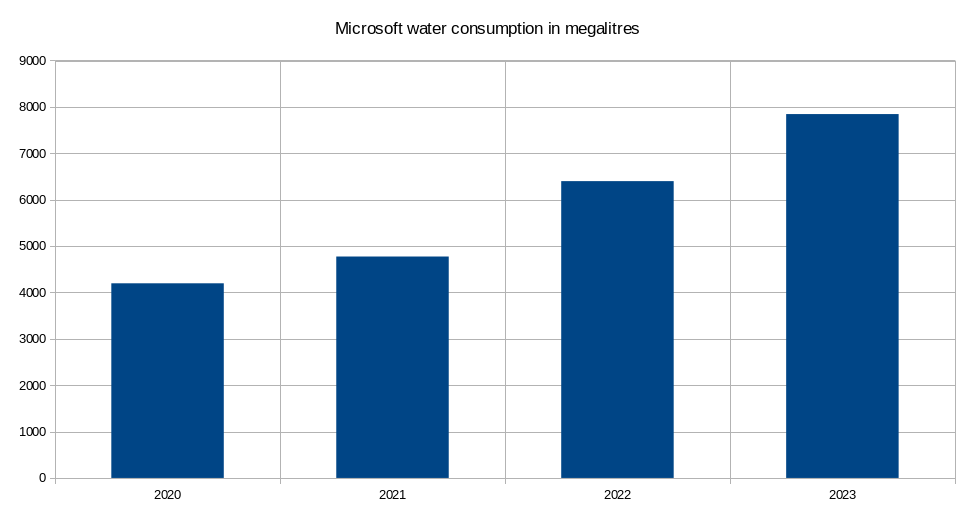
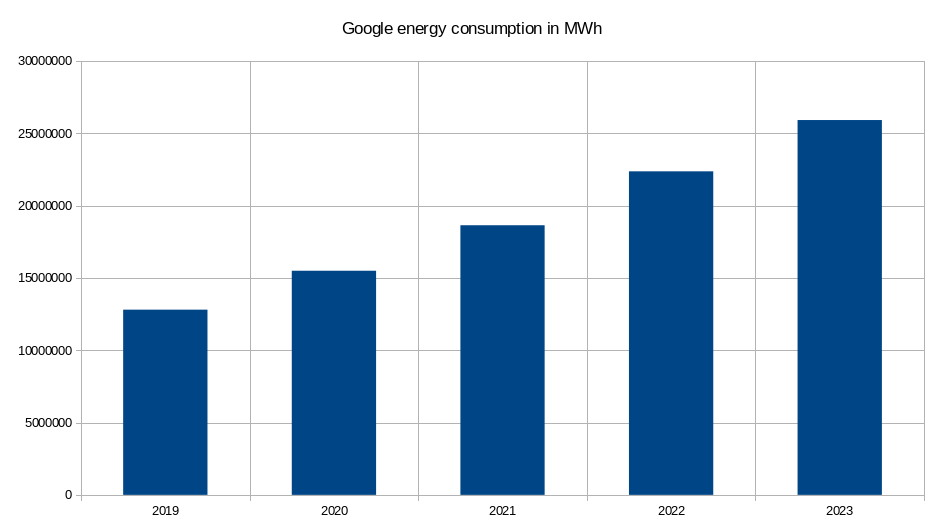
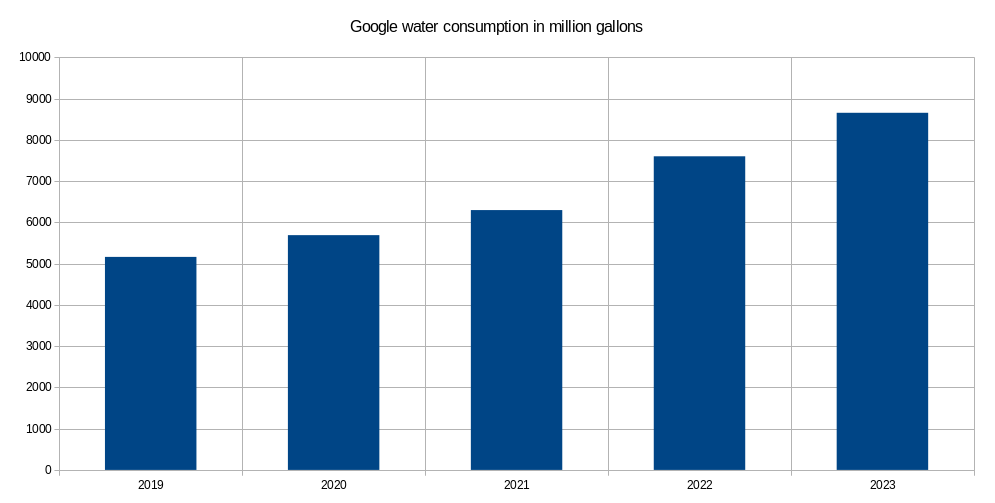
As you can see above, both energy and water consumption increased in previous two years.
How data centres fit into the picture?
If we have another look at the reports, from Google, to be exact, we can see the numbers for total water withdrawal (8653.3 million gallons) and the total water withdrawal of data centres (7657.2). This means that 88% of total water withdrawal is done by data centres.
And what about the energy going into data centres? Well, both Google and Microsoft don't show in their reports the exact consumption by data centres. Although, Google shows the PUE of its data centres. And on average, it stayed the same - 1.10. This means that 0.1 of the total energy consumption of the data centres goes to overhead cooling and support for the equipment.
But, on the other hand, if the energy and water usage increases, this is still not good. Never mind that the PUE is small. Water is used for cooling those servers. So, if energy consumption of data centres increases, alongside the water usage increases. Even though the PUE is a small number, it will not help us cool down our planet. Decrease in energy and water consumption will.
What was the cause of this increase?
Let's now go through the memory lane and the recent history of AI getting into the spotlight:
- November 2022 - ChatGPT public launch.
- January 2023 - Microsoft invests US$10 billion in OpenAI.
- February 2023 - Google announces Bard.
- And so on and so forth...
We can see that the end of the 2022 and the beginning of 2023, the hype around the AI is starting to develop.
Now, I guess the answer to the above question is obvious, no?
Where we are today?
Now, let's fast-forward to today and see what we have now.
- (Still) No major business case for using AI.
- An increase in the AI-generated content online making it harder to see facts from fiction.
- An increase in energy usage.
- An increase in water usage.
- An increase in Earth's temperature.
And it seems that we're not stopping there. Nvidia unveils Blackwell cluster that almost doubles the power consumption of chips.
What can we do about it?
Less AI training and usage
We got used to the fact that we are able to get, learn, see, discover, understand things faster, right away. But, if we want to do it properly, all these things take time. And AI will not help us there. It will give us an answer faster, true, but will that answer be correct? And often times it will be faster if we would get the answer ourselves, rather than trying to find if AI was wrong.
Having the above in mind, first and obvious answer is to reduce putting AI-enabled features in every possible service or product. Training an AI model (like GPT-3) is estimated to take as much as 1300 MWh of electricity - the annual power consumption of 130 homes in US. Using AI on the other hand, to, for example, generate an image, will take as much energy as it is needed to charge an average smartphone (~0.012 kWh).
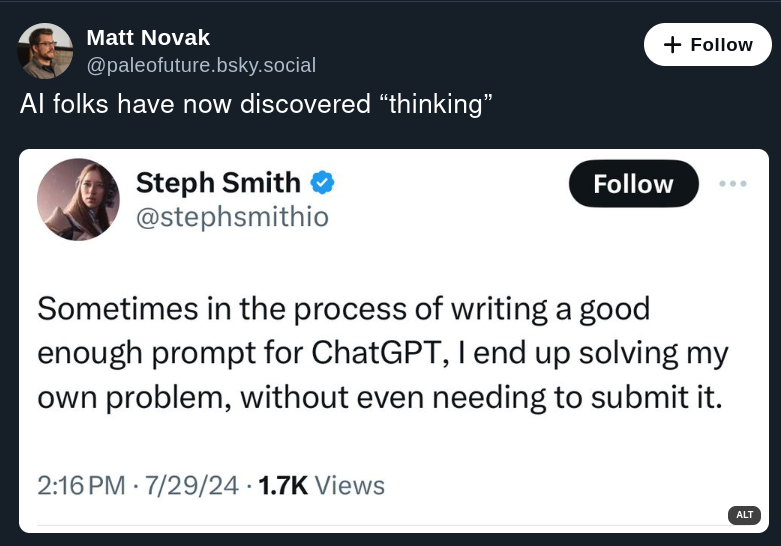
This reminds me of a post I've read.
Real-time DC metrics
The second option that could help us get more awareness would be to have more real-time power and water consumption metrics of data centres available publicly.
For example, French Cloud computing and web hosting company Scaleway shows the real-time data centre dashboards on their website. This is great!
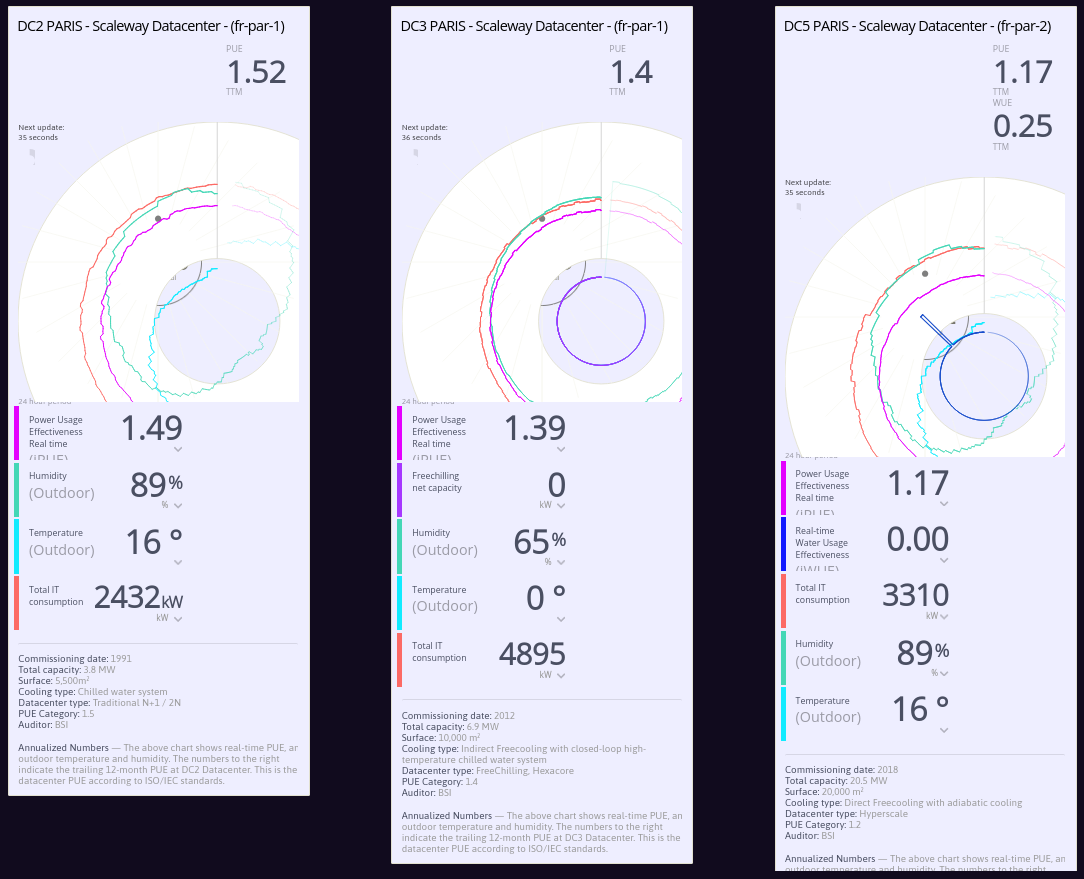
Imagine now having a sort of similar dashboard for cloud regions where you run your workloads?
Exploring other options?
Water is mainly used for cooling the hardware in data centres. As far as I know. What if there is some way to re-use that water for heating some near-by infrastructure? Or to use it to generate more electricity?
Or, is it possible to deploy data centres in a colder climate, so there will not be much energy and water needed to cool down hardware?
What do you think?
Summary
There are no easy solutions for stopping overall rise in the Earth's temperature. However, starting with something, just re-thinking how can we use resources in a better way, can be helpful.
Looking into history for examples could also help. Here, I can recommend the book I'm currently listening - History for Tomorrow, by Roman Krznaric. So far, it seems to me as a great book, and a good point of reference for implementing practices from the past in today's world.


The last but not least, we need to remember, more is not always better!
See you in the next article!